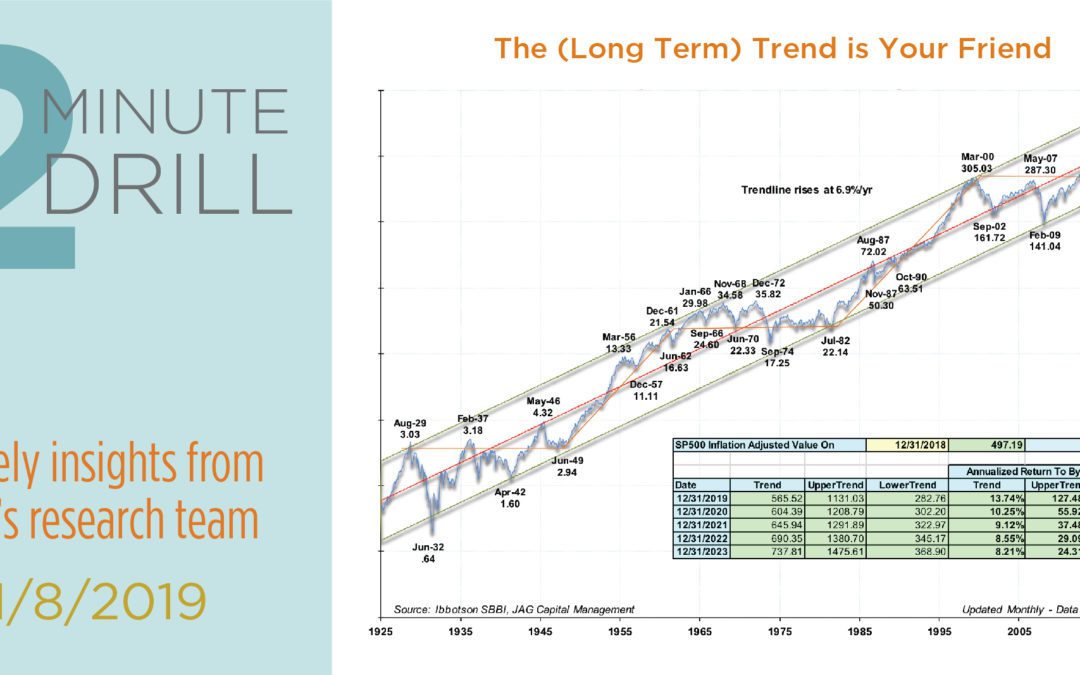

The trendline represents the annual 6.9% “real” rate of return (including dividends) the S&P 500 has produced since 1926. Note from the chart above that stocks oscillate around this line over multi-year and even multi-decade periods. For example, the dot-com bubble put the S&P 500 more than 88% above the long-term trendline in December 1999. By contrast, the Great Financial Crisis drove the S&P 500 more than 50% below its trendline in February 2009. Although hardly an ideal market-timing tool, we think this data provides some important insights for investors As detailed by the table inside the chart, if the S&P 500 were to simply regain its trendline by the end of 2023, it would generate annualized real returns of more than 8% over the next five years. Furthermore, any movement above the trendline and toward the upper channel would result in double-digit annualized returns for stock investors.
Stocks could certainly have farther to fall before they put in a durable bottom, but it is worth noting that only the deep (and global) recessions of the 1940’s, early 1980’s and 2008-2009 resulted in stocks spending multi-year periods below this long-term trendline. And barring a truly global recession, we think it is unlikely that stocks will test the lower trend channel anytime soon. Since 1926, this has only occurred 5 times, and only once since World War II. In other words, those sorts of terrible bear markets are exceedingly rare, occurring every few decades. Although time will tell, we view the current market correction as more of an opportunity for the bulls than the bears. We believe the market has priced in a significant amount of future “bad news” to come in 2019, and valuations have become quite undemanding. To the extent history is any guide, we expect 2019 to end much better than it began.